How Does Google Core Web Vitals Testing Work?
Slow page load speed can have some major consequences. Discover how to optimize Google Core Web Vitals in a way that will facilitate a speedier page render experience for users.

If you’ve been keeping an eye on your site's page load speed or overall performance you may have come across something called Google Core Web Vitals. This is Google’s way of quantifying how fast, stable, and interactive your site feels to visitors. For business owners and marketers, this isn’t just a “tech thing.” It’s a real factor in SEO rankings and a direct influence on how likely someone is to stay on your site, engage, and become a customer.
💡 Quick Tip: At Chek Creative, we use Core Web Vitals testing as a first-step health check in every Site Performance & SEO project, whether we built your site or not.
Why Do Core Web Vitals Matter?
In 2020, Google introduced Core Web Vitals as part of their ranking algorithm. These metrics measure real user experience, not just theoretical speed tests. That’s important, because Google doesn’t just care how quickly your site loads for you. It cares how it loads for the average visitor with their device, their internet connection, and their circumstances.
✅ Goal: 75% or more of your page views score “Good” on each metric.
The 3 Google Core Web Vitals (as of 2025)
As with anything in tech, algorithmic updates and news are always possible. As of the date of publishing, here are the three metrics that apply to Google core web vitals.
💡 Quick Tip: This constant monitoring is one of several ways an ongoing relationship with a web development team can prove its value in the long run.
1. Largest Contentful Paint (LCP) – Loading Speed
LCP measures how long it takes for the main, largest piece of content on your page to render and appear. Most often this is a hero image, video, or big headline.
- Good: < 2.5 seconds
- Needs Improvement: 2.54.0 seconds
- Poor: > 4.0 seconds
🛠 How to Improve LCP:
- Compress and resize images
- Remove render-blocking scripts
- Use faster hosting or a CDN
💡 Technical note: LCP isn’t just the time it takes to paint the largest content item itself; it’s measured from the beginning of the page render. So, this score will be impacted by anything render-blocking (in the critical render path) prior to the item loading, which is why render-blocking code is a common diagnostic cause for Poor LCP.
2. Interaction to Next Paint (INP) – Responsiveness
Here’s the big update: In 2024, Google replaced First Input Delay (FID) with INP.
Why? First input delay only measured the first interaction delay, sometimes missing the bigger picture. INP or "Interaction to Next Paint" measures responsiveness to all interactions (clicks, taps, and keyboard inputs) throughout the visit.
- Good: ≤ 200 ms
- Needs Improvement: 200–500 ms
- Poor: > 500 ms
📜 Historical Note: First Input Delay measured the time between a user’s first interaction and the browser’s response. It was a valuable yet incomplete metric, which explains Google’s evolution to INP for core web vitals.
🛠 How to Improve INP:
- Reduce JavaScript execution time
- Break up long-running tasks
- Optimize main-thread work
💡 Technical note: as it requires real human input/interaction, INP is the only Core Web Vitals metric that (a) can be exclusively collected via aggregate Field metrics, and (b) isn’t measurable in Lab tools (we explore the difference between field and lab measurement further below).
3. Cumulative Layout Shift (CLS) – Visual Stability
CLS measures how much elements move around during page load. Have you ever gone to click on something as the page is still loading, and right when you do, it moves, and you accidentally click on something that shifted into place under your cursor? This is a cumulative layout shift in SEO, and it makes for a frustrating user experience.
- Good: ≤ 0.10 (Ratio calculation)
- Needs Improvement: 0.10–0.25
- Poor: > 0.25
🛠 How to Improve CLS:
- Set width/height on all images and videos
- Reserve space for ads and embeds
- Avoid inserting content above existing elements
💡 Technical note: CLS is the ratio (not time) measure of the amount of shift (moving around) that page elements experience during the page render process. This is measured as a decimal fraction (e.g., .25) rather than a percent of shift (e.g., 25%), but you can think of it as a percent of shift for ease.
CLS is measured by multiplying the total percentage area of the viewport that a shifting element occupies throughout all of its shift during render (the impact fraction), multiplied by the distance across the viewport that it travels during shift (the distance fraction).
How Different Tools Measure Core Web Vitals
One of the most common questions we receive from clients is What’s the difference between CrUX, Pagespeed Insights and Google Search Console? Given that all of these tools come from Google, marketers are also often unclear on which of these tools report what and why they report so differently. Here’s a quick and easy summary of the tools relevant to the world of Google Core Web Vitals testing.
Field vs. Lab Data
- Field Data: Real-world user experience, aggregated from Chrome. Best for long-term tracking.
- Lab Data: Simulated tests you can run anytime. Best for debugging, not benchmarking.
💡 Pro Tip: High-traffic pages have the most impact on rankings, based on their heavier usage. Therefore, if your lab data is poor while your field data is in good shape, focus on high-traffic pages.
CrUX
The CrUX report collects aggregate field data or real user monitoring data (RUM) for Chrome users and identifies where Google pulls its Core Web Vitals field data from for your site. As a result, the CrUX is largely synonymous with the terms Core Web Vitals, Real User Monitoring (RUM), and Field data.
Pagespeed Insights
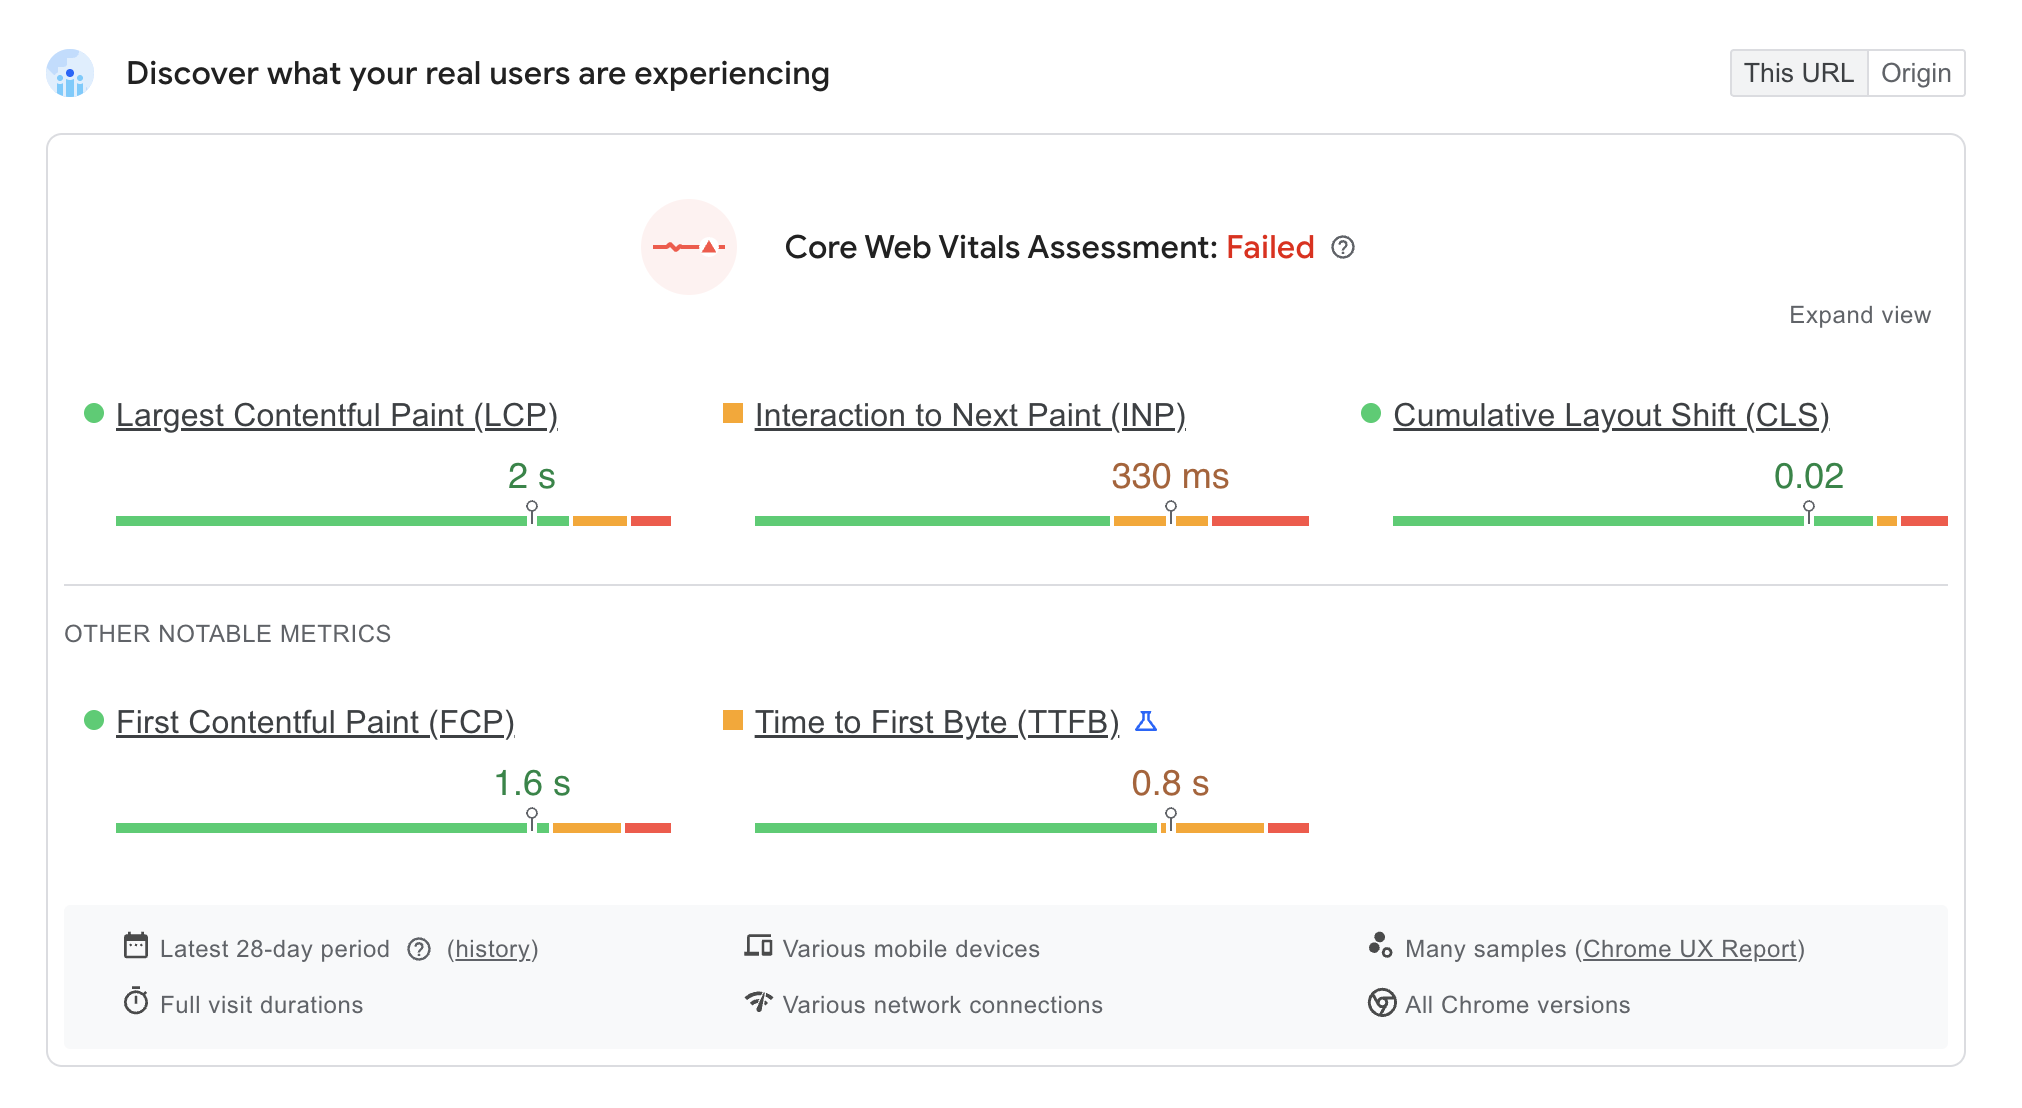
Pagespeed Insights is a Lab tool, but it does include Field metrics at the top of the report.
This top section, entitled "Discover what your real users are experiencing," is the aggregated Field metrics from CrUX. It is the aggregated average scores of all Chrome and Edge users, biased by page loads, so higher traffic pages influence these aggregate scores at a greater rate.
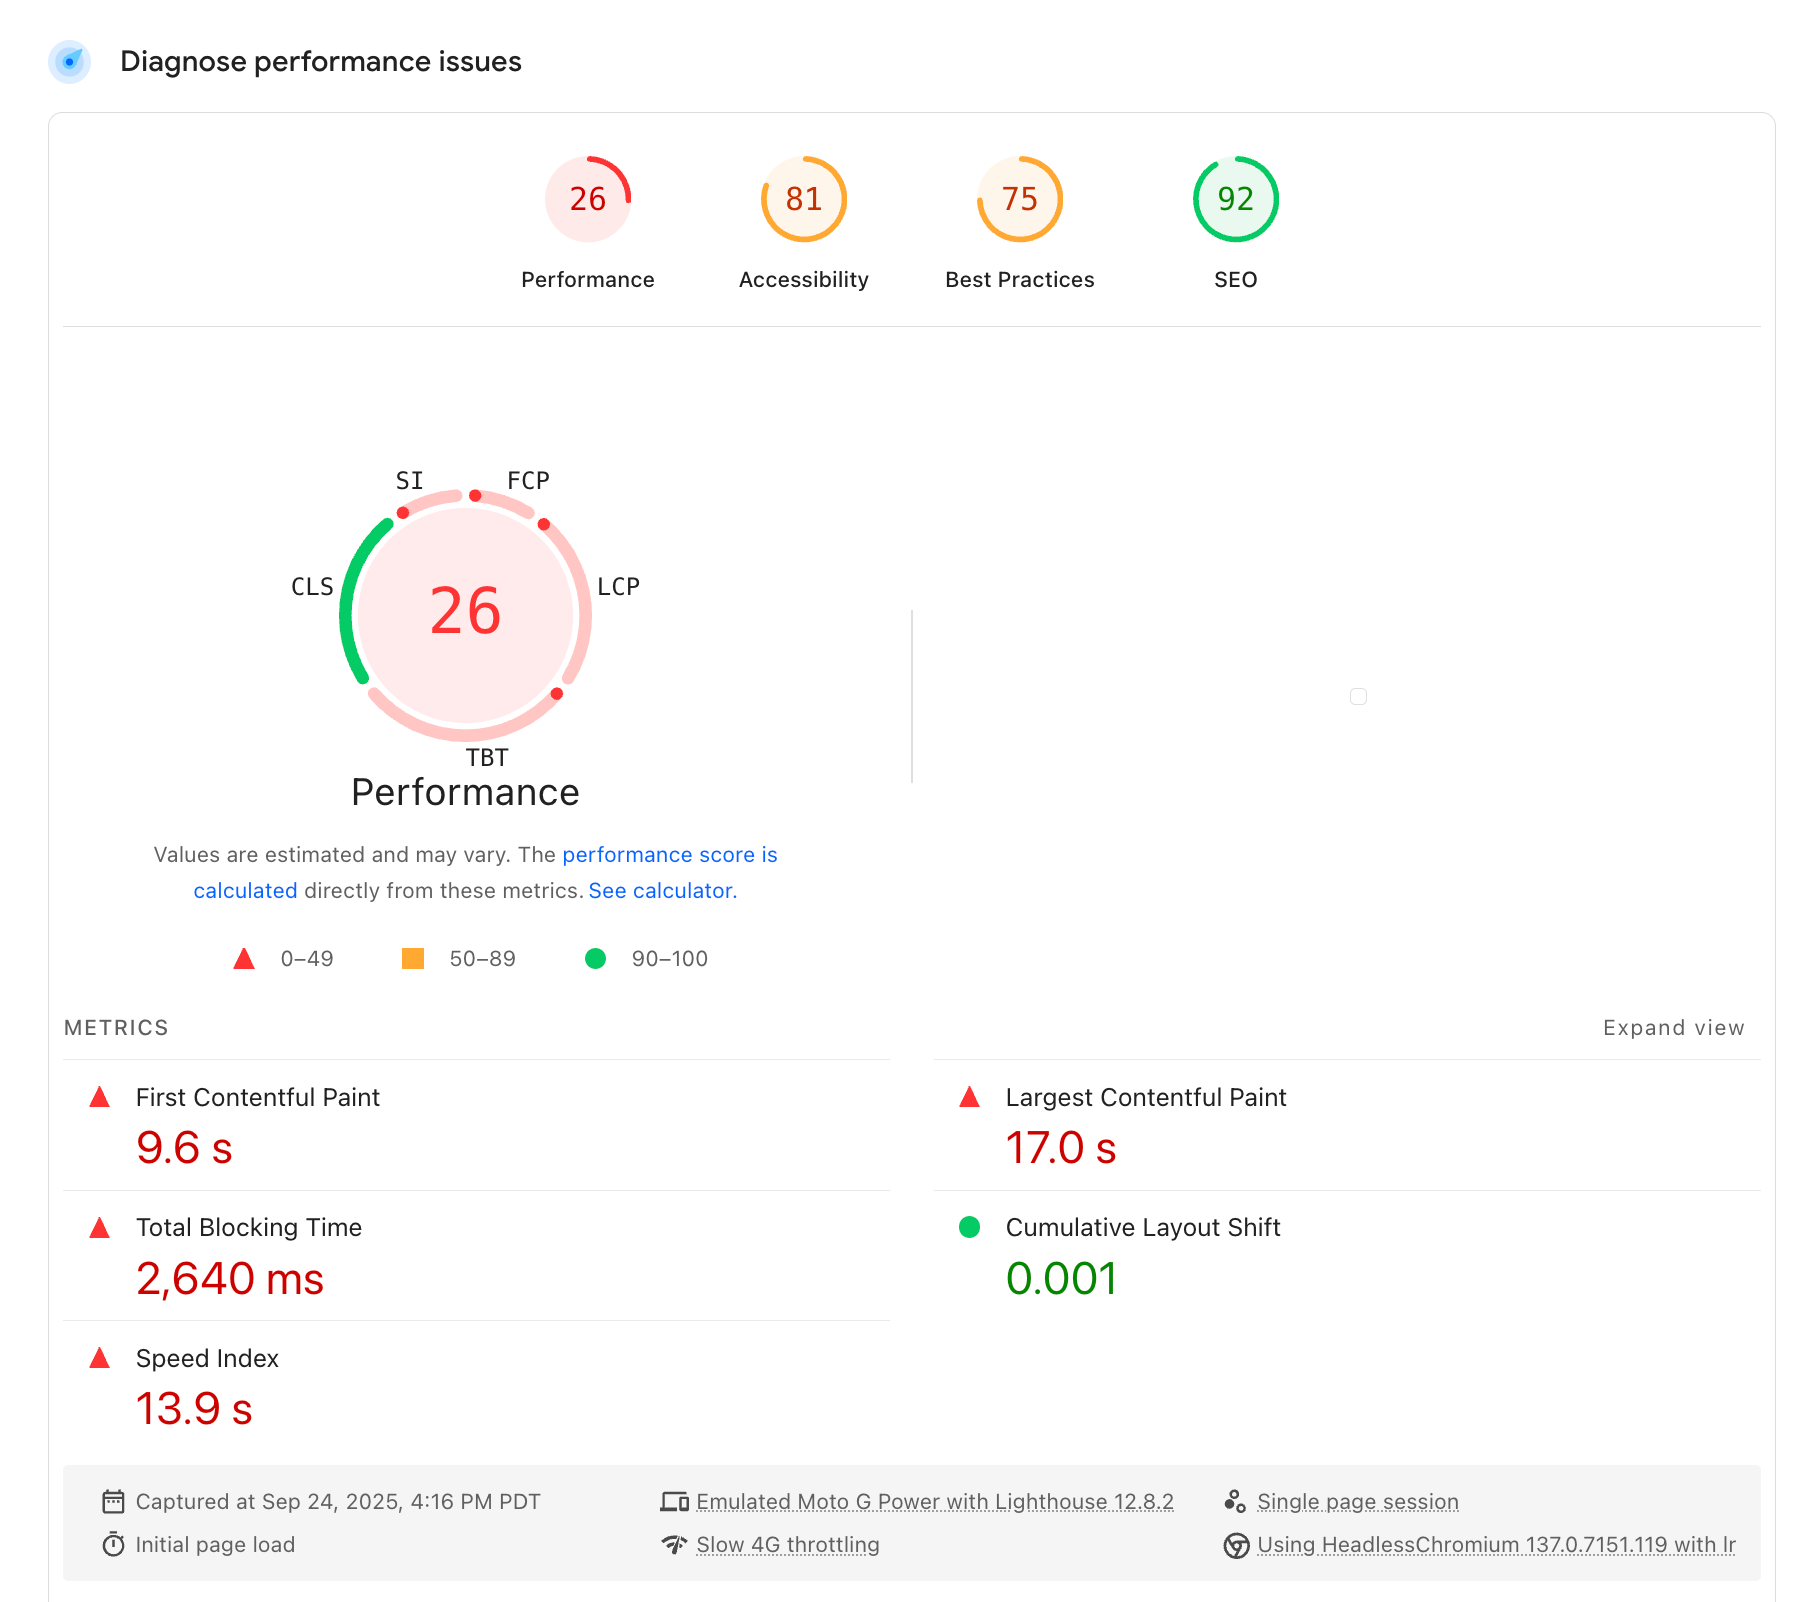
The Lab data is underneath, in the following section titled "Diagnose performance issues." This same Lab data is also known as Lighthouse. It can be run independently or within Chrome.
Google Search Console
Google Search Console primarily provides high-level reporting on whether each URL on your list is Good, Needs Improvement, or Poor, aggregating all of the three Core Web Vital scores into one, on a per-URL basis.
The way they do that is as simple as this - whichever of the three Core Web Vitals scores the lowest for a given URL, that’s the score that a URL is assigned to the URL in the Google Search Console report. Therefore, if your homepage has a Good LCP, and a Good FID (common), but a Poor LCP, then the homepage will be assigned a Poor in the Core Web Vitals report in Search Console.
That’s why you will often tend to see a lot more red and yellow in the Search Console report than you may see in the CrUX color bars at the top of Pagespeed Insights.
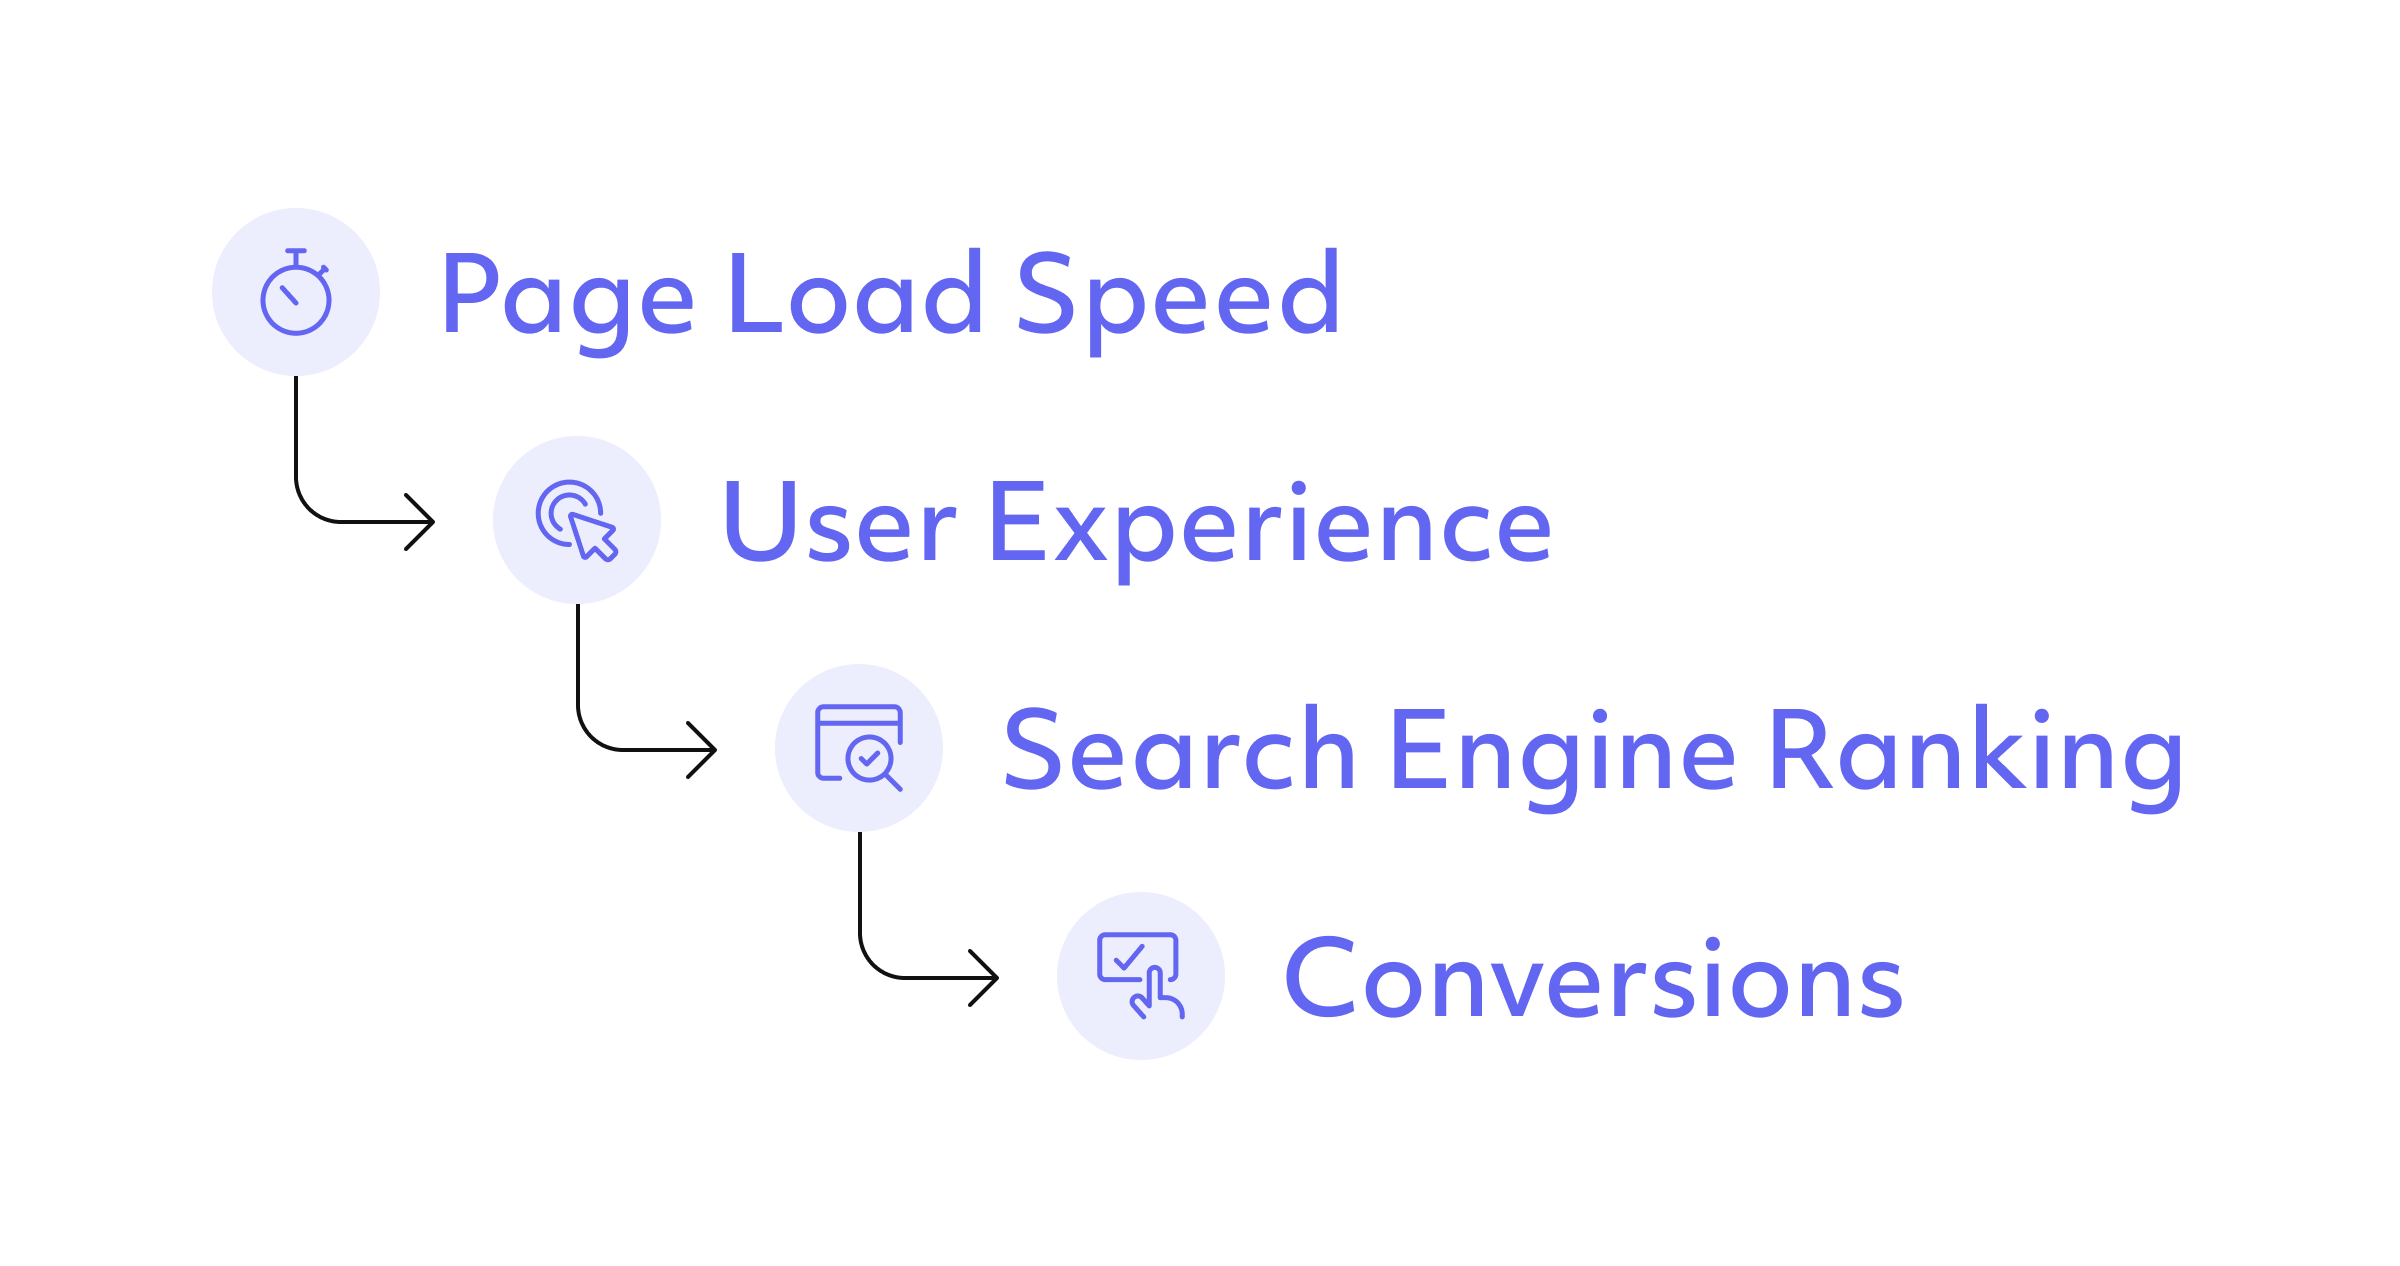
Why Core Web Vitals Matters for Your Business
Your Google Core Web Vitals aren’t just about “pleasing Google.” They’re about keeping real customers on your site long enough to turn into leads and sales.

A slow or unstable render process or website can:
- Penalize search rankings
- Increase bounce rates
- Lower conversion rate and revenue
- Hurt domain credibility
⚡ At Chek Creative, our Site Performance & SEO service includes Core Web Vitals monitoring (along with countless other considerations from image compression to targeted content recommendations. We don’t just report on Google CWV performance, we show you (down to the individual lines of code, in fact) exactly how and where to optimize your Google CWV.
Ready to Explore Organic Search Engine Optimization?
Join business leaders, digital nomads, and entrepreneurs learning the ins and outs of monitoring SEO results and website performance indicators. Contact Chek Creative to learn how your Core Web Vitals stack up within your field, and how we can work together to optimize them.